Estimation of White Dwarf Velocity Distribution Made For the First Time
Scientists unlock the secrets of elusive, near-invisible white dwarfs using new mathematical data and models. By Mephy Liu.
– 4 min read
Scientists unlock the secrets of elusive, near-invisible white dwarfs using new mathematical data and models. By Mephy Liu.
Velocity distribution plays a crucial role in understanding the dynamical structure and evolutionary process of our galaxy. However, our knowledge of the kinematics behind white dwarfs, which are stellar remnants that have exhausted all the fuel in their core, has been historically limited due to them being so dim. No nuclear fusion (the energy generating process that occurs in stars) takes place inside a white dwarf and so its low brightness comes solely from the emission of remnant heat. This makes it difficult for space-telescopes, such as the James Webb Space Telescope, to collect data on faint stellar objects. However, recently, with data released by the European Space Agency’s space telescope Gaia, a group of scientists from Lund University made the first ever estimation of velocity distribution of white dwarfs in the solar neighbourhood. The velocity distribution describes the motion of white dwarfs and allows scientists to further understand white dwarf evolution.
The astrometry and photometry provided by Gaia Early Data Release 3 (EDR3) are abundant and highly accurate because the telescope possesses the largest digital camera (nearly 1 billion pixels) ever used for space exploration [1]. However, the telescope fell short in mapping full 3D phase-space information - which impeded the analysis of velocity distribution - as a significant proportion of data lacked measured radial velocity and instead displayed only motions and positions. Although, this disadvantage was minimised based on the assumption that velocity distribution of individual stars is consistent for the entire sky, hence deeming radial velocity a needless factor for the calculation of 3D phase-space information [2]. Velocity distribution was then obtained using a penalised maximum likelihood, which is a statistical method used to estimate the parameters of the predicted model while avoiding overfitting [2].
With several limitations in magnitude uncertainty, parallax uncertainty and the re-normalised unit weight error (an indicator of the quality of the data), an unbiased sample containing 129675 white dwarfs within 500 pc of the solar neighbourhood was produced [2]. The resulting velocity distribution of the sample revealed similar features to other stars, meaning that white dwarfs and the rest of the celestial inhabitants of the solar neighbourhood generally share the same dynamical processes. This comes as no surprise as white dwarfs are just bygone low and medium mass stars.
Besides looking at the whole sample, two classifications were made for independent analysis on a Colour-Magnitude Diagram (CMD), which shows the relationship between the absolute magnitude, MG (brightness) and the colour of white dwarf stars.
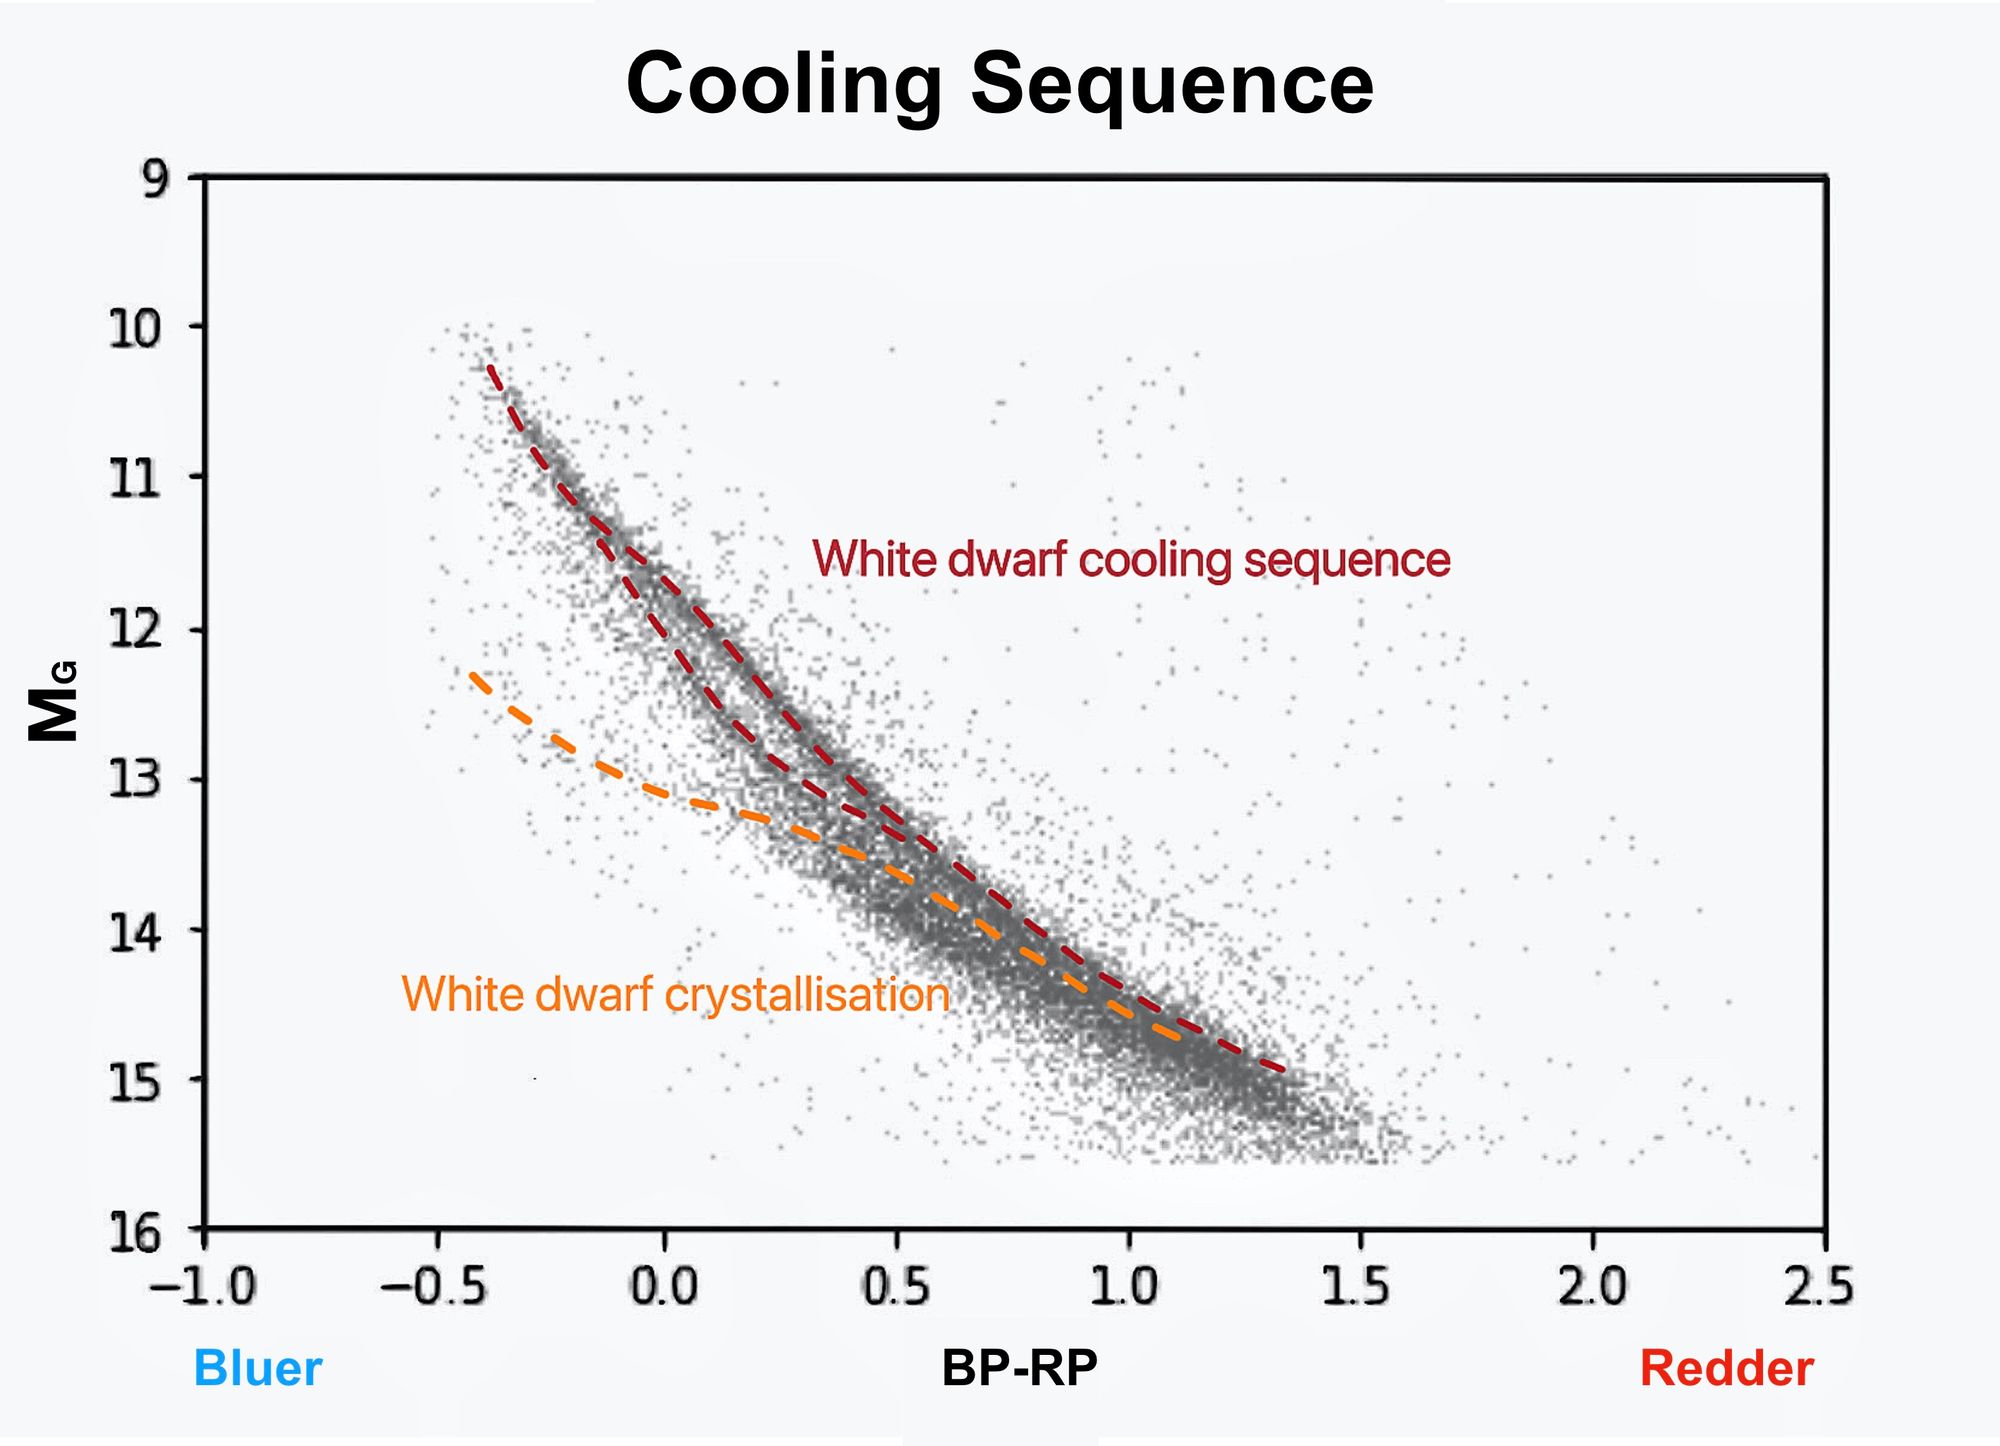
The diagram shows white dwarfs diverging into two separate branches, but what leads to this bifurcation is not yet fully understood. It is widely believed that there are two potential causes: a large number of white dwarfs having masses clustering around 0.6 and 0.8 solar masses, which likely result from mergers between white dwarfs, and different atmospheric compositions [3, 4]. Both could lead to white dwarfs cooling in two different ways, as shown on the CMD. Scientists separated two white dwarf samples based on the bifurcation and analysed their velocity distributions respectively, leading to the result that the brighter, redder sequence white dwarfs have wider varying velocity than the fainter, bluer sequence white dwarfs on the CMD [2]. This would suggest that the movement of the white dwarfs is dependent on how they have cooled. Further, it begs to reconsider the origin of the bifurcation, as binary mergers and chemical composition cannot explain these differing kinematics in the two white dwarf categories [2].
Scientists also split the sample into three subsets according to the size of their absolute magnitude, which is a measurement of stellar brightness. Since brightness drops as white dwarfs grow older, these subsets represent white dwarfs at different ages, allowing us to spot any age-dependent variation in the velocity distribution. Subsequently, as U, V and W represented three velocity dimensions, a novel structure in velocity distribution populated a certain (U,V) region and a double-peaked feature in W was identified. Both patterns took place only in older populations with lower brightness [2]. The region around (U,V) = (7,-19) km/s has an over-abundant number of low-brightness white dwarfs with an identified peak. This novel structure may be present because those dim white dwarfs belong to the same moving group that share a common motion in the solar neighbourhood: the Coma Berenices stream, for example, which is an association of stars that is a remnant of a star cluster located in the northern sky [2].
The statistical and analytical skills involved in this study explored the possibility of mapping a full 3D velocity distribution without the access to radial velocity. In the future, more research with incomplete stellar information may be possible using similar techniques. The first estimation of white dwarf velocity distribution provides key insight into the study of white dwarf bifurcation and more importantly, our understanding of stellar kinematics, which means that more simulations and development can be made to paint the picture of the history of our galaxy.
As one of the researchers on the study Daniel Mikkola said, “This study is important because we learned more about the closest regions in our galaxy. The results are also interesting because our star, the Sun, will one day turn into a white dwarf just like 97 percent of all stars in the Milky Way.”
[1] The European Space Agency. Frequently Asked Questions About Gaia. [online] Available at:https://www.esa.int/Science_Exploration/Space_Science/Gaia/Frequently_Asked_Questions_about_Gaia [Acessed 16 September 2022]
[2] Mikkola, D., McMillan, P., Hobbs, D. and Wimarsson, J., 2022. The velocity distribution of white dwarfs in Gaia EDR3. [online] Available at: < https://arxiv.org/pdf/2202.07672.pdf > [Accessed 16 September 2022].
[3] Dufour, P., Blouin, S., Coutu, S., Fortin-Archambault, M., Thibeault, C., Bergeron, P., Fontaine, G., 2017. The montreal white dwarf database: a tool for the community. [online] Available at: <https://aspbooks.org/publications/509/003.pdf> [Accessed 16 September 2022]
[4] Kilic, M., Hermes, J., Cósico, A., Kosakowski, A., Brown, W., Antoniadis, John., Calcaferro, Leila., Gianninas, A., Althaus, L., Green, M., 2018. A refined search for pulsations in white dwarf companions to millisecond pulsars. [online] Available at:< https://academic.oup.com/mnras/article/479/1/1267/5036529?searchresult=1> [Accessed 16 September 2022]